April 20, 2024

[STOCK WATCH] KOR ZINC falls 3%
Target price 560,600 won, has 21% disparate to increase compared with stock price. Per analysts' expectations during the recent month, the average target price of KOR ZINC is 560,600 won. The stock price is 461,000 won as of yesterday, so there is 99,600 won (21%) disparate in order to be able to increase.
Financial structure Overview
P/E ratio and P/B ratio
Yesterday, foreigners bought 4,727 shares, while institutions sold 5,051 shares. As a shareholding sum by investor group for the past 4 weeks, institutions have bought 82,782 shares with trending trade. However, during the same period, foreigners have sold 47,227 shares with maintenance of a selling position and individuals have sold 35,555 shares in a lessening selling trend. Turnover Rate and Price Range both proper Regarding the statistics for the past month on trade volume as the total outstanding shares, the daily turnover rate of KOR ZINC was 0.25%. And the daily volatility, the average range of rise and fall, during the same period is 2%. Institution 42%, Foreigners 37.45% As per the inquiry for shareholding by investor group, the major investor group is Institutions with 42% from total outstanding shares. Foreigners and individuals each hold 37.45% and 20.53%. And as recent 5-day shareholding change by investor group, institutions is the major investor group with 40.33%. Foreigners hold 36.63% and individuals hold 23.02%.
| ||||||||||||||||||||||||||||||||||||||||||||||||||||||||||||||||||||||||||||||||||||||||||||||||||||||||||||||||||||||||||||||||


By HeRo (hero@heraldcorp.com)
This article is produced by the algorithm developed by the artificial intelligence developer ThinkPool in collaboration with Herald Corp.
EDITOR'S PICKS
-
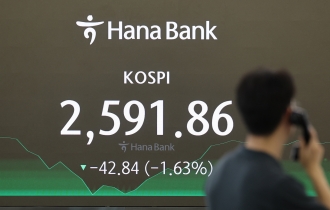
Seoul shares rattled by Israeli attack on Iran; Kospi dips to nearly 11-week low

-
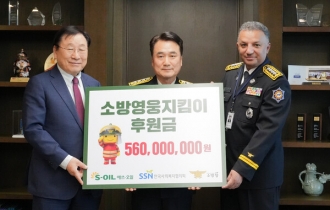
S-Oil donates W560m to support firefighters
-
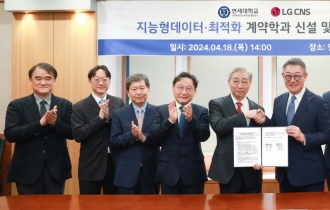
LG CNS teams up with Yonsei University to nurture AI specialists
-
Polestar 4 to make Korean debut in June
-
S. Korea pledges W23tr venture capital fund for green investment at G20 meeting
-
Sungsimdang outperforms bakery giants to log sales over W100b
-
France rejects opening Paris flight routes to T'way Air, deals blow to Korean Air merger
-
SK hynix chief underscores chip cooperation between Korea, US