[STOCK WATCH] Hyundai Wia rises 3%
Target price 113,100 won, has 45% disparate to increase compared with stock price. Per analysts' expectations during the recent month, the average target price of Hyundai Wia is 113,100 won. The stock price is 77,700 won, so there is 35,400 won (45%) disparate in order to be able to increase.
Financial structure Overview
P/E ratio and P/B ratio
The joint selling by institutions and foreigners is noticed. Institutions have been selling for the past 8 trading days and foreigners have been selling for the past 6 trading days. As a shareholding sum by investor group for the past 4 weeks, foreigners have sold 57,246 shares and institutions have sold 423,652 shares with a selling trend. However, during the same period, individuals have bought 480,898 shares with an increasing position. Turnover Rate and Price Range both proper Regarding the statistics for the past month on trade volume as the total outstanding shares, the daily turnover rate of Hyundai Wia was 0.39%. And the daily volatility, the average range of rise and fall, during the same period is 1.58%. Institution 30.42%, Foreigners 25.42% As per the inquiry for shareholding by investor group, the major investor group is individuals with 44.14% from total outstanding shares. Institutions and foreigners each hold 30.42% and 25.42%. And as recent 5-day shareholding change by investor group, individuals is the major investor group with 44.37%. Institutions hold 30.43% and foreigners hold 25.19 %.
| ||||||||||||||||||||||||||||||||||||||||||||||||||||||||||||||||||||||||||||||||||||||||||||||||||||||||||||||||||||||||||||||||


By HeRo (hero@heraldcorp.com)
This article is produced by the algorithm developed by the artificial intelligence developer ThinkPool in collaboration with Herald Corp
EDITOR'S PICKS
-
KGC eyes broader customer base with Lim Young-woong


-
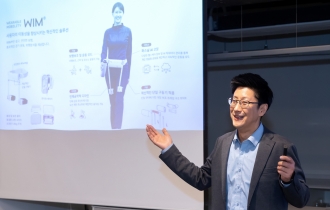
Korean robot startup aims to transform human walking
-
Coway launches Berex massage bed with enhanced usability

-
Hyundai Mobis breaks ground for W170b Spain plant

-
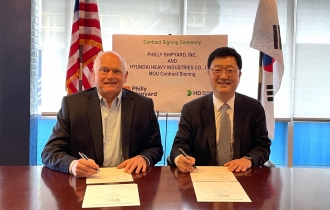
HD Hyundai teams up with Norway's Philly Shipyard for US footing
-
Hanwha Life taps into global banking through Indonesian investment

-
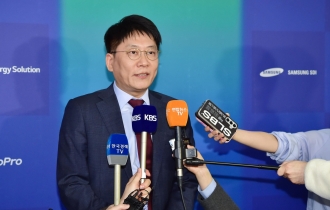
LG Energy Solution vows stern action to protect patent rights
-
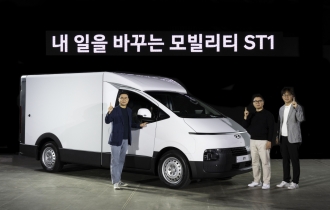
Hyundai unveils versatile commercial EV platform